After seeing more than one news story describing how Lyme Disease will likely be more prevalent this year, I made a quick map comparing number of Lyme Disease cases by county for 2000-2007 and 2008-2015.
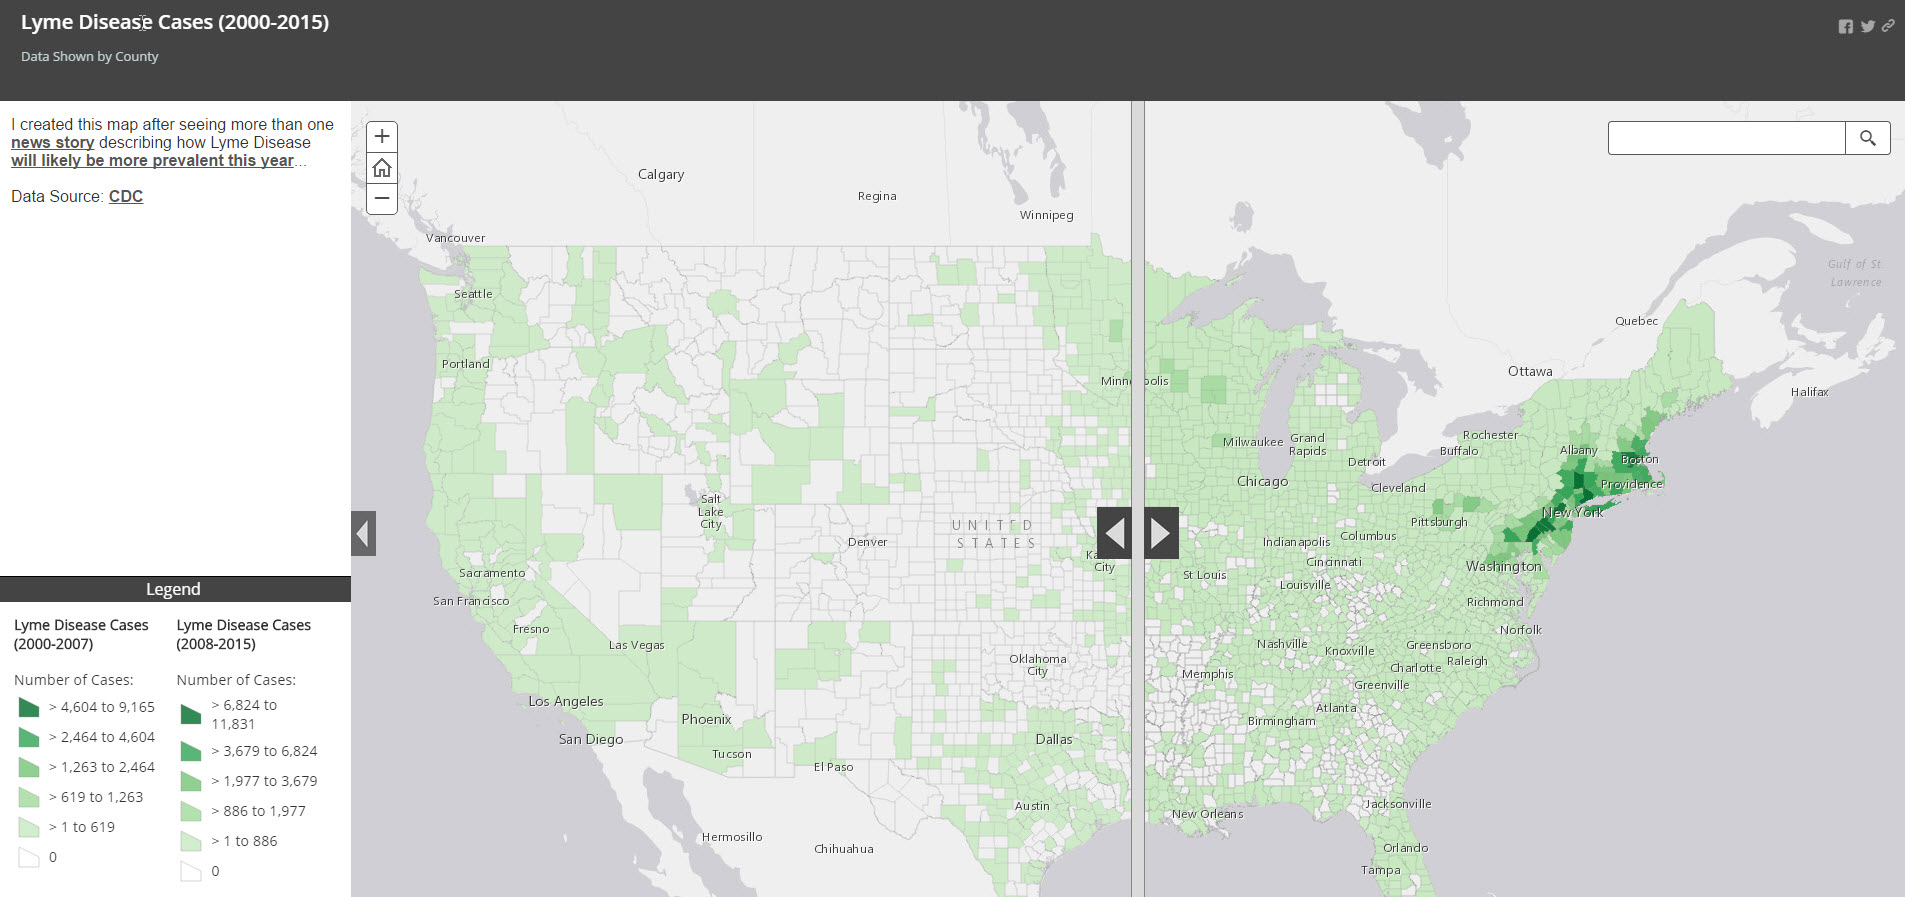
Data is from the CDC.
After seeing more than one news story describing how Lyme Disease will likely be more prevalent this year, I made a quick map comparing number of Lyme Disease cases by county for 2000-2007 and 2008-2015.
Love the idea for this map (and that your first reaction to there being supplemental data in an article is to map it)! Is this a case where you would want to make the thresholds of the two classification schemes identical for the sake of comparison? For example, York County Virginia (right under the Harrisburg label) looks like it stayed in the same second to highest category (with 2,627 cases in 2000-2007 and 4,876 in 2008-2015) If both years were displayed with the classification on the left, it should be a category higher 2008-2015. If displayed with the classification on the right, it would be a category lower in 2000-2007.